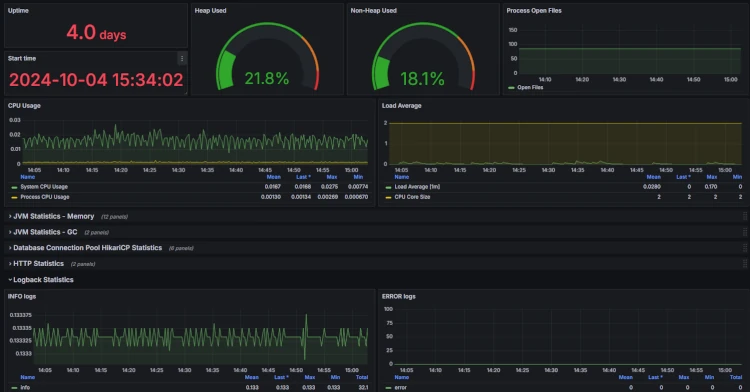
In today’s digital world, servers and applications are the backbone of every organization. To ensure everything runs smoothly, server monitoring is essential. It helps detect issues early and prevents them from turning into major outages or performance problems. By keeping an eye on key metrics such as CPU usage and memory consumption, we can optimize our systems and improve the user experience.
This is where Prometheus and Grafana come into play. Prometheus is a powerful open-source tool that helps you keep track of all important data. It collects and stores metrics in real time and makes monitoring dynamic environments straightforward. Grafana complements this with excellent visualization capabilities, allowing you to create dashboards that clearly present your data and help you quickly identify trends and patterns.
With this combination of Prometheus and Grafana, you have the ideal solution to keep your servers under control and make data-driven decisions. This way, you stay ahead and can address potential issues proactively.
Setting up Prometheus and Grafana with Docker Compose
The fastest way to get Prometheus and Grafana up and running is by using Docker. This saves a lot of time when it comes to configuration and security, as Docker provides a solid foundation. The provided Docker images are already well preconfigured, making it very easy to get started.
If you haven’t installed Docker Compose yet, take a look at the official documentation here: https://docs.docker.com/compose/install/linux/.
Prometheus and Grafana Docker containers
To get started, simply create a new docker-compose.yml file on your server where Docker and Docker Compose are already installed:
version: '3.7'

services:
  prometheus:
    image: prom/prometheus
    container_name: prometheus
    volumes:
      - ./prometheus.yml:/etc/prometheus/prometheus.yml
    ports:
      - "9090:9090"

  grafana:
    image: grafana/grafana
    container_name: grafana
    ports:
      - "3000:3000"
    environment:
      - GF_SECURITY_ADMIN_PASSWORD=admin
WARNING: You should definitely not leave the password set to “admin” if the server is accessible from the outside. Otherwise, script kiddies and similar attackers may gain access to your system.
Prometheus configuration file
In the directory where your docker-compose.yml is located, you also need to create a file named prometheus.yml. Then add the following configuration:
global:
  scrape_interval: 15s

scrape_configs:
  - job_name: "prometheus"
    static_configs:
      - targets: ["localhost:9090"]
Here we have defined a scrape job that accesses the service at localhost:9090, which is the Prometheus server itself. With this configuration, Prometheus loads various expressions that you can use to read metric data related to the Prometheus server.
Accessing Prometheus and Grafana
Once the configuration is in place, you need to start the Docker containers using the following command:
docker-compose up -d
If no firewall or similar restrictions are in place, Prometheus and Grafana should now be accessible.
To access Prometheus, use the following URL:<server-ip>:9090
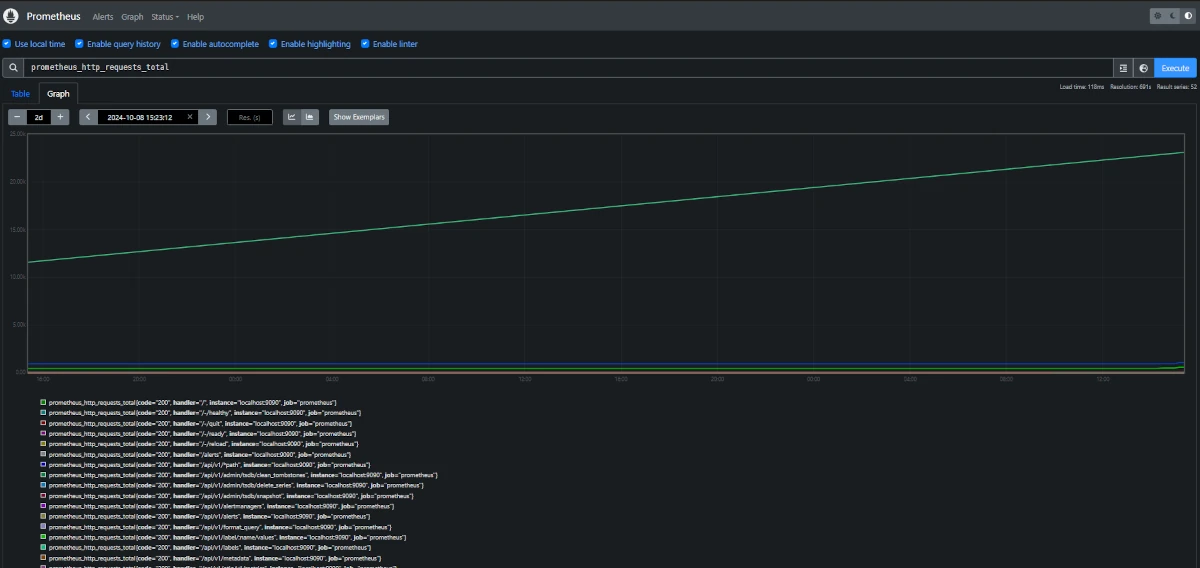
Since we defined a scraper in the configuration file that reads metrics from the Prometheus container, you can, for example, display the number of HTTP requests using this link:<server-ip>:9090/graph?g0.expr=prometheus_http_requests_total&g0.tab=0&g0.display_mode=lines&g0.show_exemplars=0&g0.range_input=1h
To access Grafana, use the following URL:<server-ip>:3000
Log in using the password defined in your docker-compose.yml file.
As you can see, Grafana is still quite empty. Before defining your own dashboard, you need to connect Prometheus as a data source. To do this, open the following URL:<server-ip>:3000/connections/datasources/new
Select Prometheus and use the following URL:<server-ip>:9090
Save the configuration.
Visualizing Prometheus metrics in Grafana
In Grafana, metric data is defined and visualized in dashboards. To create a dashboard, open the following URL:<server-ip>:3000/dashboards
Create a new dashboard by clicking “New” in the top-right corner. Then choose “Add visualization” and select Prometheus as the data source.
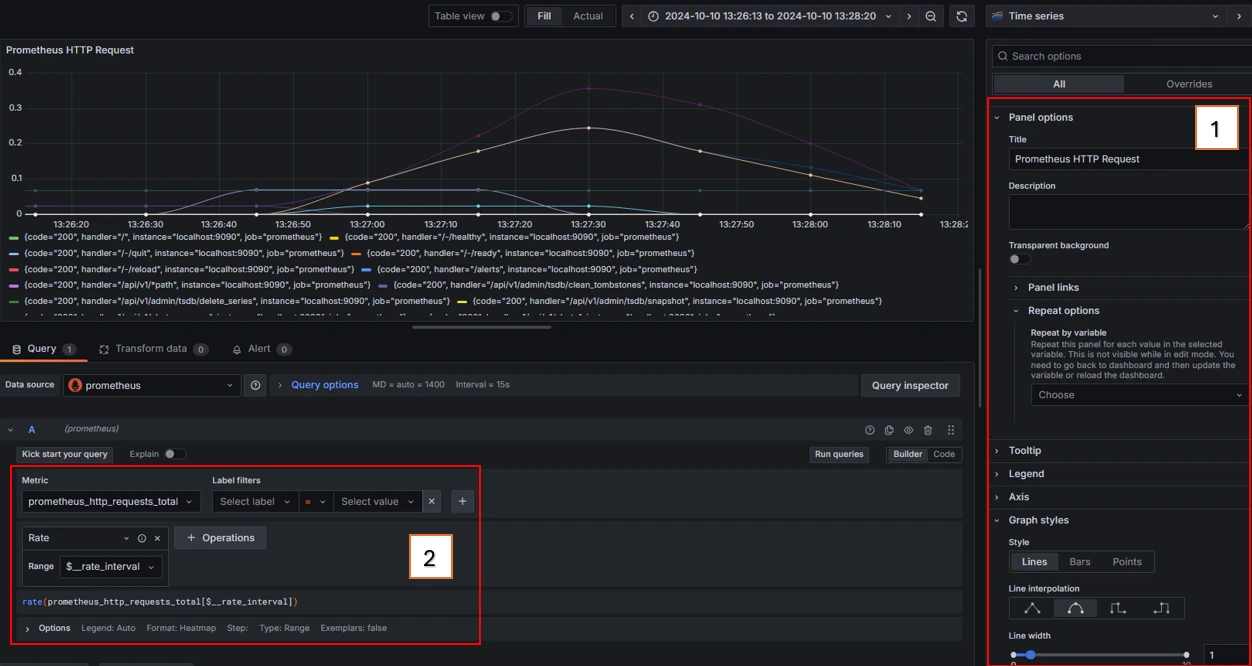
In the first step, you can easily configure the panel. A panel contains one or more metrics pulled from the data source. Here you define all relevant display settings, such as title, background, graph styles, and more.
In the second step, you decide how the metric should be visualized. You first select a metric and can then filter the data, for example by specific codes available within the metric. You can also apply various operations, such as calculating averages and much more.
You can find more details in Grafana’s official documentation:
https://grafana.com/docs/grafana/latest/panels-visualizations/query-transform-data/#add-a-query
And that’s it! You should now have Prometheus and Grafana set up and ready to experiment with. Together, Prometheus and Grafana form a powerful duo for monitoring and visualization. Both tools are flexible and offer many ways to keep an eye on your systems and applications.
Prometheus is your go-to tool when it comes to collecting and storing metric data in real time. It pulls data from your servers and applications, stores it, and provides a powerful query language to analyze it. Prometheus really shines when monitoring microservices and dynamic environments.
Grafana perfectly complements Prometheus when it comes to visualizing metric data. You can create interactive dashboards that show the behavior of your systems at a glance. With Grafana, you not only make Prometheus data visible, but also tailor it exactly to your needs.
Together, Prometheus and Grafana provide a powerful monitoring system that allows you to keep track of both infrastructure performance and application stability.
Reading Spring Boot metrics in Prometheus and Grafana
Now let’s take monitoring to the application level.
Imagine you have a Spring Boot application with high traffic and plenty of logs stored across different areas. In this section, I’ll show you how to set everything up using a Prometheus dependency and Promtail to ship logs to Loki. Loki acts as an interface that Grafana uses to visualize log files.
Installing the Spring Boot Prometheus dependency
We use Maven as the build tool here, but the same approach works with Gradle.
Maven:
Add the following dependency to your pom.xml file:
<dependency>
  <groupId>io.micrometer</groupId>
  <artifactId>micrometer-registry-prometheus</artifactId>
</dependency>
Gradle:
For Gradle, adjust your build.gradle file and add the following line:
implementation 'io.micrometer:micrometer-registry-prometheus'
Then rebuild your project to apply the changes.
Spring Boot Prometheus configuration
To make the metrics accessible, you must add the following to your application.properties or application.yml:
management.endpoints.web.exposure.include=prometheus
management.endpoint.prometheus.enabled=true
This ensures that Prometheus metrics are exposed via the appropriate endpoint.
Warning: If Spring Boot Security is enabled, make sure to explicitly allow this endpoint so you can access the metrics.
Configuring Spring Boot metrics in Prometheus
Next, you need to configure the scraper in the Prometheus configuration.
Add the following section to your prometheus.yml file:
global:
  scrape_interval: 15s

scrape_configs:
  - job_name: 'prometheus'
    static_configs:
      - targets: ['localhost:9090']

  - job_name: 'spring-boot'
    metrics_path: "/actuator/prometheus"
    static_configs:
      - targets: ['<springboot-server-ip>:8080']
After applying the changes, restart the container.
If everything worked correctly, you should now find new expressions in Prometheus or Grafana, such as jvm_info.
Spring Boot Metrics – Grafana example dashboard
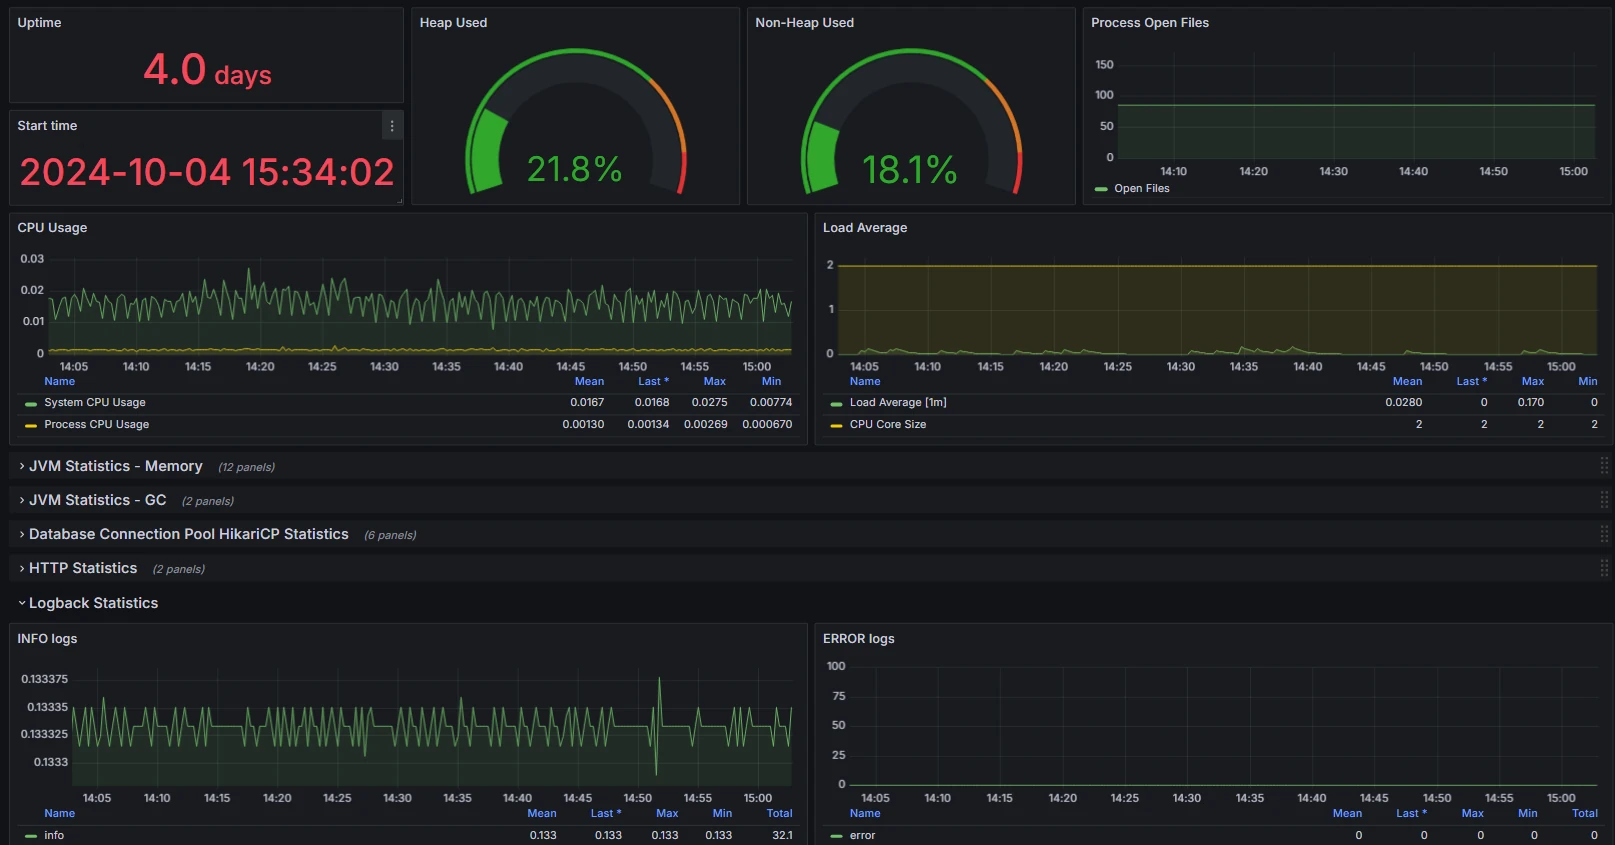
At the following link, you will find the dashboard ID or JSON file that you can easily import into Grafana:
https://grafana.com/grafana/dashboards/19004-spring-boot-statistics/
Reading Spring Boot logs in Grafana
Reading Spring Boot logs in Grafana is particularly useful because it allows you to monitor the performance and behavior of your application in real time. Centralized log visualization helps you identify and analyze issues more quickly, enabling more efficient debugging and optimization processes. Grafana lets you search logs interactively and correlate them with metrics, significantly simplifying error diagnosis. This way, you not only keep an overview of your logs but can also make well-founded decisions to improve your application.
For this setup, Docker must also be installed in order to run the Promtail Docker image on the server where Spring Boot is running. Promtail is used to ship logs to Loki. Loki can also be installed as a Docker image and is queried by Grafana, as Grafana already provides a Loki data source to visualize logs. This part is completely independent of Prometheus.
Docker Compose on the Spring Boot server with Promtail installation
To do this, create a docker-compose.yaml file on the Spring Boot server with the following content:
version: '3.8'
services:
  promtail:
    image: grafana/promtail:latest
    container_name: promtail
    volumes:
      - ../tomcat/logs:/var/log
      - ./promtail-config.yml:/etc/promtail/promtail-config.yml
    command: -config.file=/etc/promtail/promtail-config.yml
    restart: always
Warning: The path ../tomcat/logs is only an example. Make sure to adjust the path to match the actual location of your log files.
Promtail configuration
Create a new file named promtail-config.yml and use the following template as its content:
server:
  http_listen_port: 9080
  grpc_listen_port: 0

positions:
  filename: /tmp/positions.yaml

clients:
  - url: <grafana-server-ip>/loki/api/v1/push

scrape_configs:
  - job_name: "tomcat-logs"
    static_configs:
      - targets:
          - localhost
        labels:
          job: "tomcat"
          __path__: /var/log/*.log
Make sure to adjust the url entry to point to your Grafana server.
You can then start the container.
Loki installation and configuration
Loki should be installed on the same server as Grafana. To do this, extend the docker-compose.yml on your server as follows:
version: '3.7'

services:
  prometheus:
    image: prom/prometheus
    container_name: prometheus
    volumes:
      - ./prometheus.yml:/etc/prometheus/prometheus.yml
    ports:
      - "9090:9090"

  grafana:
    image: grafana/grafana
    container_name: grafana
    ports:
      - "3000:3000"
    environment:
      - GF_SECURITY_ADMIN_PASSWORD=admin

  # add loki
  loki:
    image: grafana/loki:2.9.10
    container_name: loki
    command: -config.file=/etc/loki/local-config.yaml
    restart: always
    ports:
      - "3100:3100"
You can now start the Loki container as well.
Connecting Loki to Grafana
Navigate again to:
<server-ip>:3000/connections/datasources/new
Select Loki as the data source this time and use the following URL:
<server-ip>:3100
You can then create a new dashboard and use Loki as the data source.
Spring Boot INFO logs – Grafana example dashboard
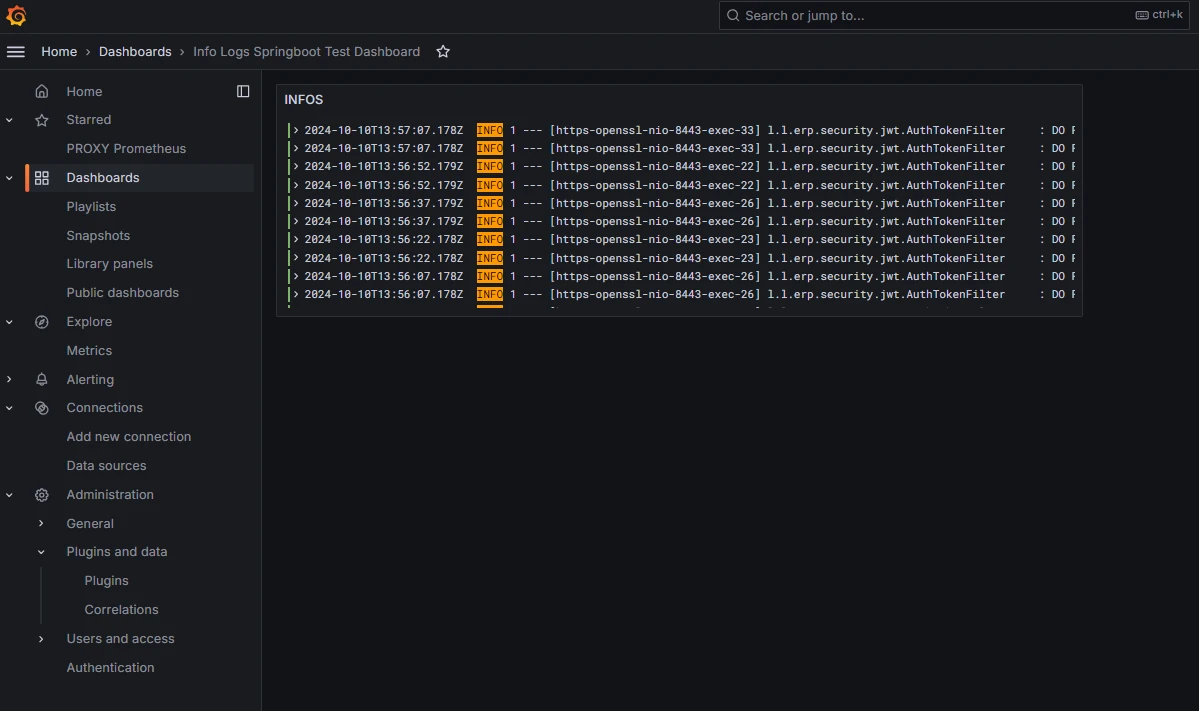
As an example, you can import this dashboard directly as JSON. As shown in the image, it should display INFO logs. Of course, you can remove or adjust filters and customize it as needed:
{
  "annotations": {
    "list": [
      {
        "builtIn": 1,
        "datasource": {
          "type": "grafana",
          "uid": "-- Grafana --"
        },
        "enable": true,
        "hide": true,
        "iconColor": "rgba(0, 211, 255, 1)",
        "name": "Annotations & Alerts",
        "type": "dashboard"
      }
    ]
  },
  "editable": true,
  "fiscalYearStartMonth": 0,
  "graphTooltip": 0,
  "id": 8,
  "links": [],
  "panels": [
    {
      "datasource": {
        "default": false,
        "type": "loki",
        "uid": "fdzus37vrepkwb"
      },
      "description": "",
      "gridPos": {
        "h": 7,
        "w": 12,
        "x": 0,
        "y": 0
      },
      "id": 98,
      "options": {
        "dedupStrategy": "none",
        "enableLogDetails": true,
        "prettifyLogMessage": true,
        "showCommonLabels": false,
        "showLabels": false,
        "showTime": false,
        "sortOrder": "Descending",
        "wrapLogMessage": false
      },
      "pluginVersion": "11.2.0",
      "targets": [
        {
          "datasource": {
            "type": "loki",
            "uid": "fdzus37vrepkwb"
          },
          "editorMode": "builder",
          "expr": "{filename=\"/var/log/spring.log\"} |= `INFO`",
          "hide": false,
          "queryType": "range",
          "refId": "A"
        }
      ],
      "title": "INFOS",
      "type": "logs"
    }
  ],
  "schemaVersion": 39,
  "tags": [],
  "templating": {
    "list": []
  },
  "time": {
    "from": "now-6h",
    "to": "now"
  },
  "timepicker": {},
  "timezone": "browser",
  "title": "Info Logs Spring Boot Test Dashboard",
  "uid": "fe0ggsmsm2igwd",
  "version": 3,
  "weekStart": ""
}
And there we have it! The configuration is finally complete. You can now enjoy visualizing both logs and metric data from your Spring Boot application in Grafana. Having everything in one place makes it much easier to monitor application performance and react quickly to potential issues.
Grafana gives you a powerful way to present collected data effectively. You can create interactive dashboards that provide instant insight into the health of your application. Whether it’s performance monitoring or error analysis, the combination of Prometheus, Grafana, and Spring Boot gives you the control and visibility you need.
Have fun experimenting with metrics and logs!